Where Can I See Order and Revenue Statistics?
Having reliable and accurate statistics lets you properly assess the performance and make informed decisions to drive your store’s growth and customer satisfaction. This is where the Analytics tool of SiteGround Ecommerce comes into play.
It tracks your store’s orders and revenue to provide insights into its strengths and areas for improvement.
How to Access the Analytics Section
To access your store statistics, open the Site Admin > Analytics section.
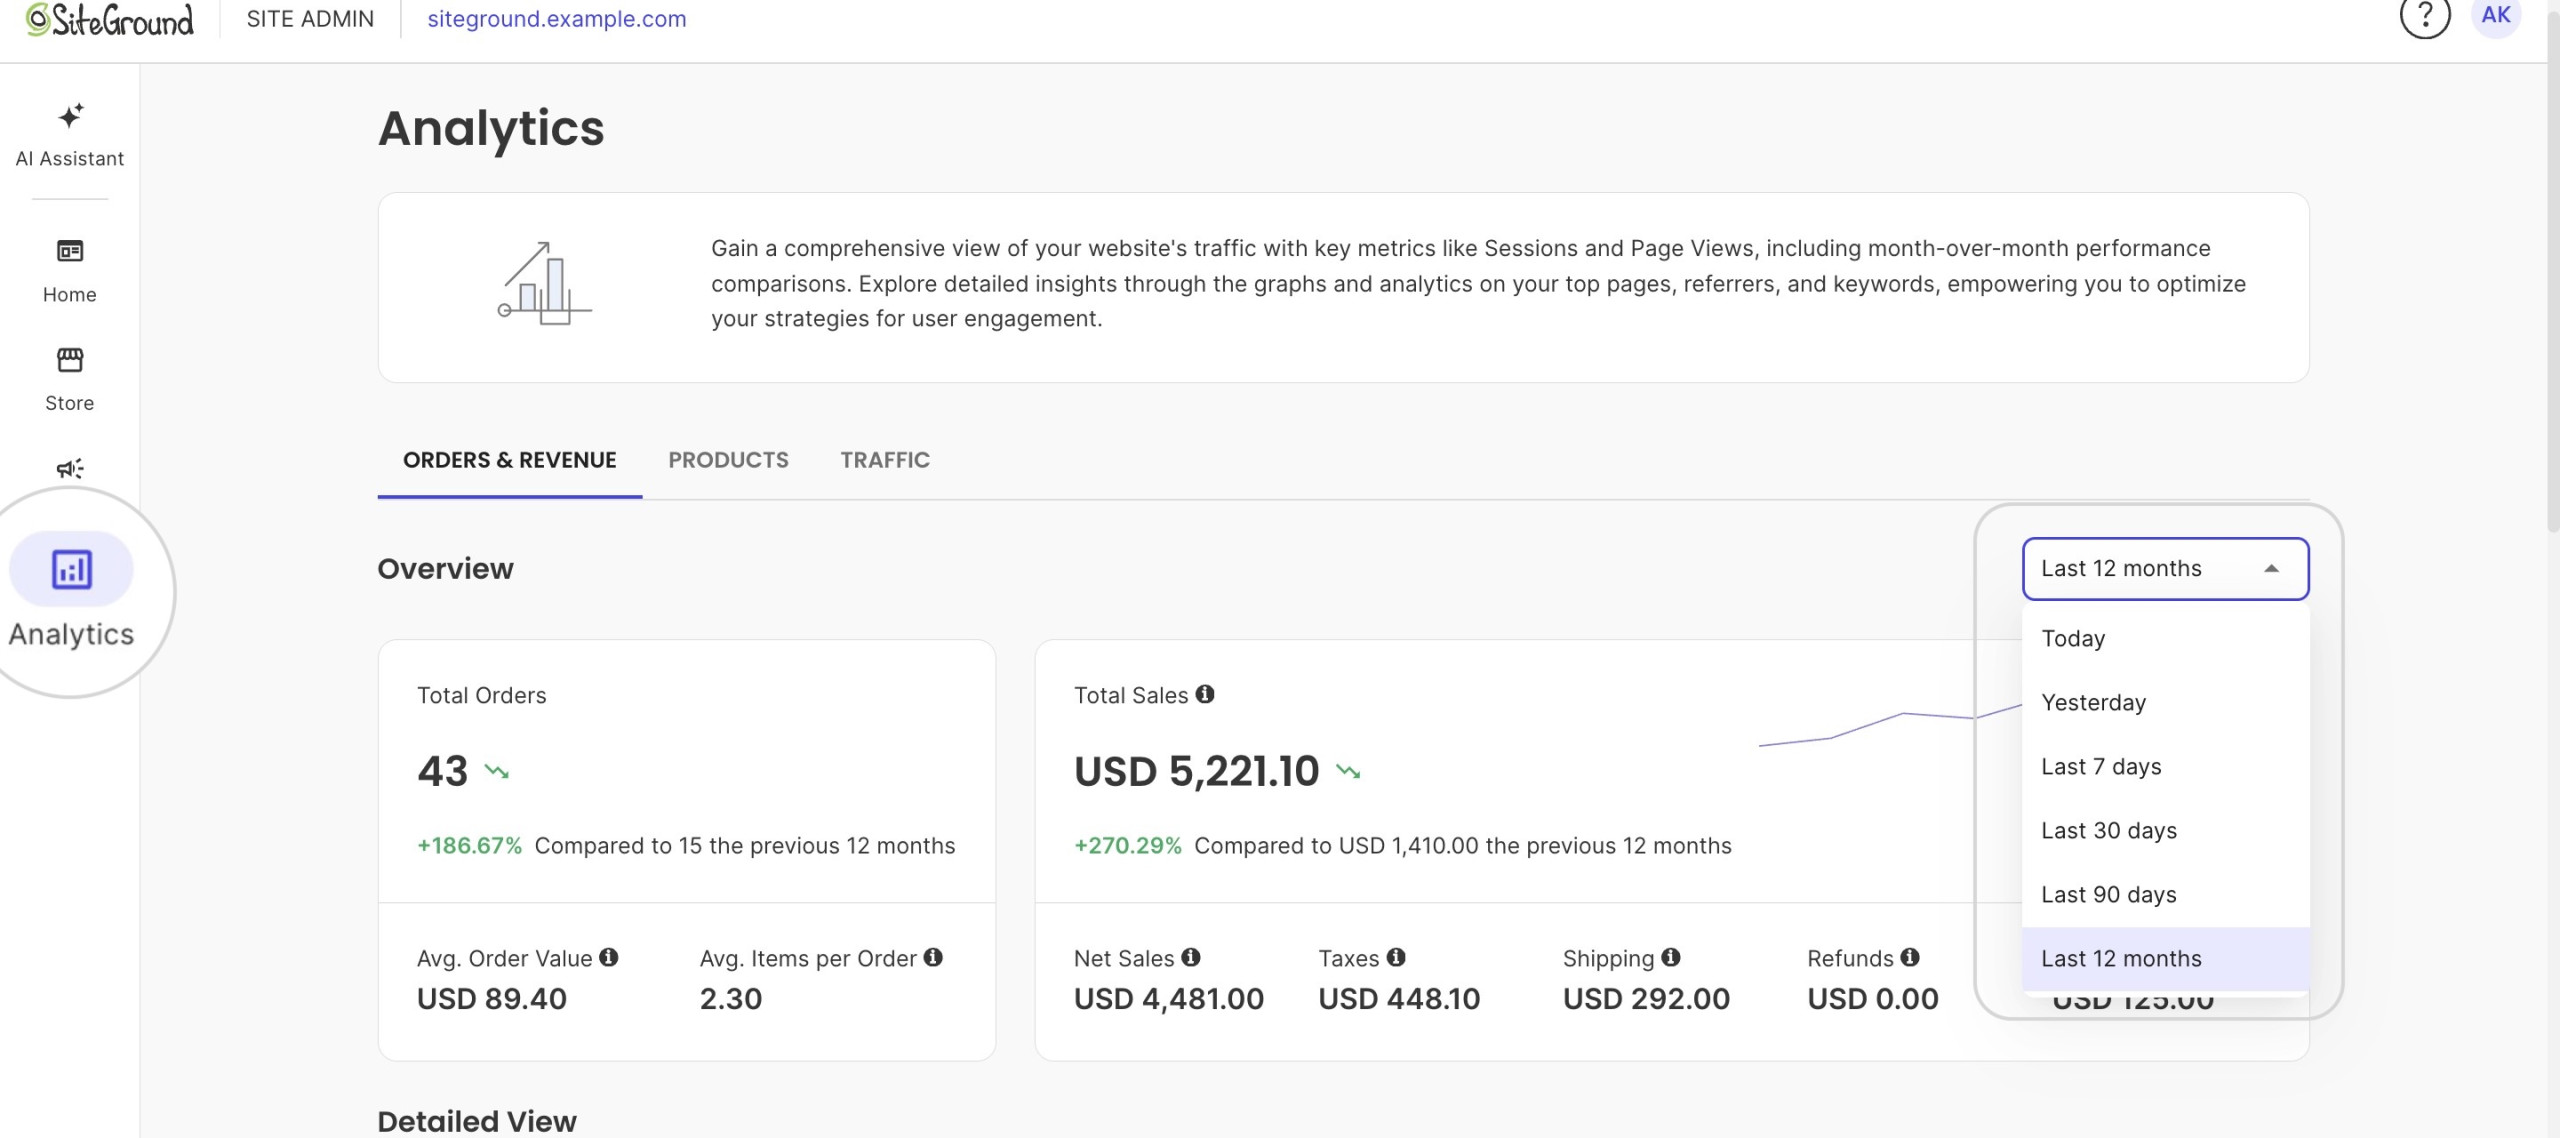
How to Change the Analytics Time Period
The Analytics tool displays statistics for different time periods. To change the period, navigate to the top-right corner and select the desired timeframe from the drop-down menu.
How to View Order and Revenue Statistics
The Analytics tool separates the data into three major categories:
- Orders & Revenue – statistics about the orders and revenue made during the selected period.
- Products – statistics about product stock and sold items for the selected period.
- Traffic – general traffic statistics such as page views, number of visitors, top keywords, etc.
To see the statistics about the orders and revenue, click on Orders & Revenue.
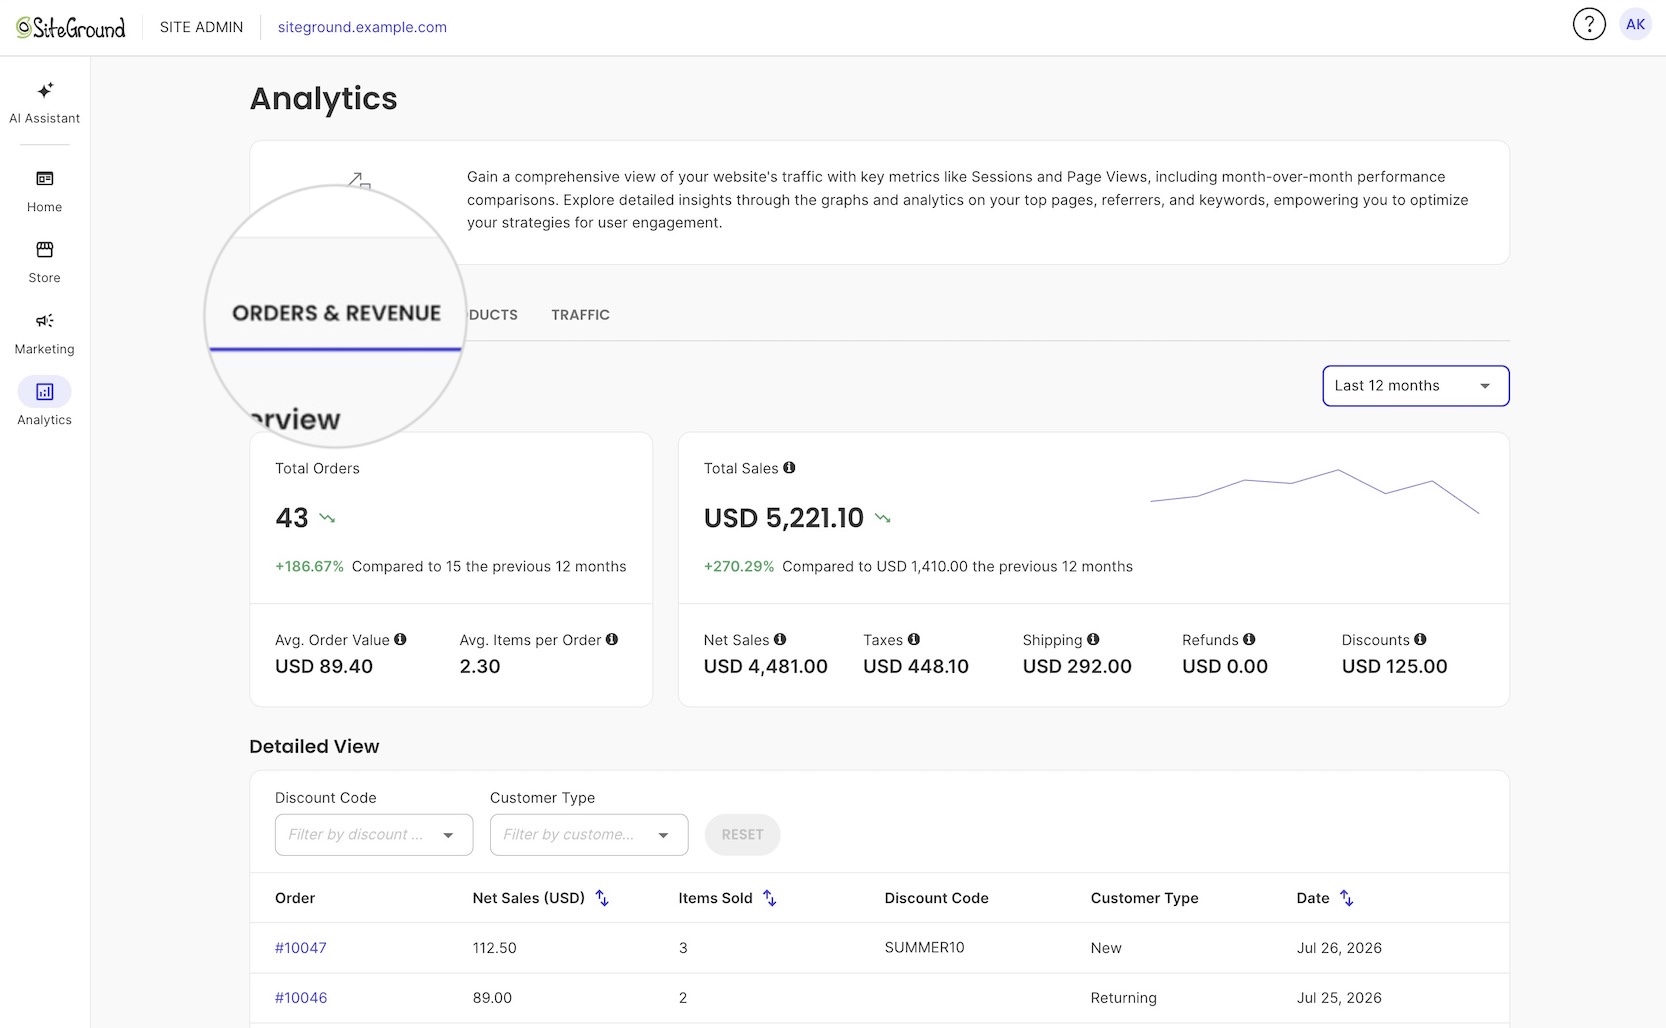
Here, you can examine a few key metrics for your store activity. The left side of the screen displays statistics related to the orders.
- Total Orders – displays the number of orders made in the selected timeframe and compares it to the orders for the previous period.
- Average Order Value – the average value for an order during the selected period. The number represents the Net Sales divided by the Total Orders.
- Average Items per Order – it is the Items Sold divided by the Total Orders.
The right side displays the sales metrics as the amount in your default currency, along with trends and comparisons to previous periods.
- Total Sales – This equals the Product price x Quantity ordered for the time period, including Taxes and Shipping, excluding Refunds and Discounts. It is accompanied by a graph representing the trends during the selected time.
- Net Sales – This is calculated as the Total Sales excluding Taxes and Shipping.
- Taxes – The taxes collected from orders and shipping.
- Shipping – Charges collected from shipping.
- Refund – The amount refunded to customers.
- Discounts – The sum of total discounts.
Below the general statistics, the Detailed view section lists all orders for the selected period. Each order is logged with the following details:
- Order – the unique order number.
- Net Sales – the total net value of the order in the default currency of your store.
- Items Sold – the number of items sold in the order.
- Discount Code – displays the discount code that the customer applied to the order. If none is used, the column is empty.
- Customer Type – indicates if the customer is new or returning.
- Date – the date and time of the order.